Qeexo AutoML enables machine learning application developers to do analysis of different performance metrics for their use-cases and equip them to make decisions regarding ML models like tweaking some training parameters, adding more data etc. based on those real-time test data metrics. In this article, we will discuss in detail regarding live classification analysis module.

Once the user clicks on Live Classification Analysis for a particular model, they will be directed to the Live Classification Analysis module that would resemble below screenshot.

In this module we won’t be discussing Sensitivity analysis. To refer to details regarding sensitivity analysis, please read this blog.

For the purpose of this blog, we will use a use-case which aims to classify a few musical air gestures: Drums, Violin and Background. These datasets can be found here.
Live Data Collection
Qeexo AutoML supports live data collection module which can be used to collect data to do analysis on. Data
collection requires a Data collection library to be pushed to the respective hardware. A user can push the library by clicking the “Push To Hardware” button shown below.

Once, they click the button and the library flashing is successful, the user will be able to record the data for trained classes in the model for analysis purpose. The user can select any number of seconds of data to do the analysis on. For this particular use-case, we have 3 Classes: Drums, Background and Violin as shown below.

Once the user clicks “Record”, they will be redirected to Data Collection page as shown below. This module is same as the Data Collection module which is used to collect training data.

As the user collects data for respective classes, they will be able to able to see the data in tabular format shown below. They can see the dataset information, delete data and re-record based on their preference.

Once, the user has collected the data, they can select whichever data they want to do analysis on by selecting the checkbox as shown above. Once, the user has selected atleast 1 dataset, they will see the Analyze button is activated and as we say, with Qeexo AutoML, “a click is all you need to do Machine Learning”, they will be able to analyze different performance metrics!

Performance Metrics
Qeexo AutoML supports 5 different types of performance metrics listed below:
- Confusion Matrix: Represents True Labels and Predicted Labels in square matrix. Diagonal (upper left to lower right) elements indicates instances correctly classified. Off-diagonal elements indicate instances mis-classified. Summing instances over each row should sum to total instances for the respective class.
- F-1 Score: Measures the 1st harmonic mean of Precision and Recall. Computed as 2 * (Precision * Recall)/(Precision + Recall). Precision measures out of all the samples detected of a given class, how many are relevant. Recall measures out of all the relevant samples of a given class, how many are detected.
- Matthews Correlation Coefficient: Measure of discriminative power for binary classifiers. In the multi-class classification case, it quantifies which combinations of classes are the least distinguished by the model. The values can range between -1 and 1, although most often in AutoML the values will be between 0 and 1. A value of 0 means that the model is not able to distinguish between the given pair of classes at all, and a value of 1 means that the model can perfectly make this distinction.
- ROC Curve: Plots the False Positive Rate (FPR, x-axis) vs. True Positive Rate (TPR, y-axis) for each class in the classification problem. The dotted line indicates flip-of-the-coin performance where the model has no discriminative ability to distinguish among the classes. The greater the area under the curve (AUC), the better the model.
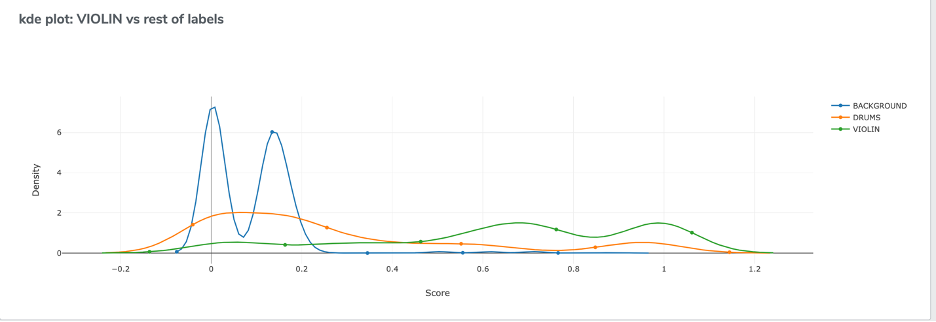
- Kernel Density Estimation plots: This will result in n plots, where n = Number of trained classes. This plot shows the estimated probability density function for each class vs rest of the classes.
For the use case of this blog, please find respective metrics below:
Confusion Matrix

ROC Curve

Matthews Correlation Coefficient

F-1 Score

Kernel Density Estimation (KDE)


With these performance metrics, a user can determine how “well” the model is performing on test data or in live classification scenario. With the help of this module, a user can decide different aspects of a ML pipeline like whether to retrain a model with different parameters, whether more data will help improving the performance or different sensitivities for different classes should be considered. In a nutshell, Live Classification Analysis enables the user to take more control over ML model development cycle based on performance analysis on test data.
