edgeRX Documentation

Table of Contents
Set Up
Setting Up an Account for Your Organization (Customer Account)
How do I power on my edgeRX Gateway?
How do I add my edgeRX Gateway to my dashboard?
How do I turn on my edgeRX sensor?
How do I install my edgeRX sensor on my equipment?
How do I setup my edgeRX sensor on my dashboard?
How do I setup assets on the edgeRX dashboard?
Machine Learning in edgeRX
Viewing AI Inference Results: A Step-by-Step Guide
How Can I be Notified About Important Events?
Machine Learning Model for AI Inference Results
Maintenance
Introduction
TDK SensEI’s edgeRX platform is a complete solution for real-time equipment health monitoring. edgeRX leverages edge AI to process data locally at the source for faster, more accurate, and more efficient insights. edgeRX is a user-friendly, low-maintenance solution that optimizes the collection, analysis, and management of machine health data. By continuously monitoring the health status of critical assets, edgeRX reduces unexpected downtime, optimizes maintenance to improve efficiency and effectiveness, and enables predictive maintenance for users.
This guide provides a comprehensive step-by-step approach to configuring the system, including setting up the gateway, integrating edgeRX sensors, and effectively using the edgeRX dashboard for monitoring machine performance. By leveraging real-time data visualization on the dashboard, operators can proactively address maintenance needs, reducing downtime and operational costs.
What’s Inside?
- One edgeRx Gateway
- One power adaptor
- Two Antennae
- One Ethernet adaptor
- edgeRx Sensors
Setup
Setting Up an Account for Your Organization (Customer Account)
Follow these steps to create and set up an account for your organization:
1. Navigate to the user setting page.

2. The TDK SensEI team will set up an organization account on the edgeRX dashboard and grant access to a designated admin user. The admin can create different roles and assign specific permissions based on your organization’s requirements.

3. For first-time access, the admin should check their email for login credentials (username and password) to sign in to the edgeRX dashboard.

4. If any issues arise during login or account setup, please contact the TDK SensEI support team or reach out via email for assistance.
How do I power on my edgeRX Gateway?
1. Choose a factory location within 100 meters (line of sight) of your edgeRX sensors that you expect to mount on your equipment.
2. Plug your power adaptor into the edgeRX gateway port labeled “DC/RS485” and plug the adaptor into a wall outlet or similar power source.
3. Plug your ethernet adaptor into the edgeRX gateway port labeled “PoE” and plug an ethernet cord into the edgeRX gateway. Ensure that your ethernet cord has a solid internet connection.
4. Screw all antennae onto your edgeRX gateway.
5. Notice the green lights on the gateway should light up as it boots up.
How do I add my edgeRX Gateway to my dashboard?
1. Use your provided edgeRX dashboard website and login information to access your edgeRX dashboard. Confirm that you can visualize the edgeRX dashboard landing page (see below example).
Note – Initially, the landing page of the edgeRX dashboard will appear empty since the system is in the process of establishing connection with the edgeRX gateways and edgeRX sensors. Data and analytics will only become visible once the setup is complete, including the proper installation of edgeRX gateways, sensors, and the generation of AI inference results.
TDK SensEI enhances this process by enabling real-time AI-driven insights at the edge. Once the system is fully configured, users can leverage SensEI’s advanced analytics to monitor machine health, detect anomalies, and predict failures, ensuring seamless and proactive maintenance.

2. Navigate to the edgeRX gateway page (ex. Network –> GW2201D 2.0)

3. Confirm you’re on the edgeRX gateway page.

3. Add your new edgeRX gateway to the edgeRX dashboard with the “Add” button.
4. Enter the MAC Address (also known as the Gateway ID) printed on your edgeRX gateway. Enter a custom name you’d like to use to describe your edgeRX gateway. Select where in your factory the edgeRX gateway is located. When finished, press “Add”.

5. Check that your edgeRX gateway is online and connected using the Status field. If your edgeRX gateway appears offline, contact your TDK SensEI representative.

After successfully connecting the edgeRX gateway, the next step is to install edgeRX sensors to enable continuous monitoring of machine health and early detection of potential failures. These sensors play a vital role in capturing real-time data, which is then processed and analyzed to generate AI inference results. This allows the system to assess machine status – such as alarms or warnings – ensuring seamless operations and proactive maintenance.
How do I turn on my edgeRX sensor?
1. First, unscrew the small screws on the sides of the edgeRX sensor.
2. Next, firmly pull open the blue cover of the sensor.
3. Once the edgeRX sensor is open, install a battery.
4. Then, switch the device from OFF to ON.
5. An LED should start to blink to indicate the power is on.
6. Finally, replace the blue cover and screws to re-secure your edgeRX sensor.
How do I install my edgeRX sensor on my equipment?
1. Choose the correct location on your equipment to mount your edgeRX sensor
- Choose a location as close to the vibration source as possible for maximum signal.
- The edgeRX sensor should be installed on non-rotating parts.
- See appendix sensor installation guidelines.
2. Use a high-quality epoxy (we recommend the 5 Minute Epoxy available at most construction hardware stores).
3. Mix the epoxy according to the specific instructions and place the epoxy on the base of the sensor.
4. Place the sensor on your equipment in the spot chosen in step 1.
5. Wait the recommended time for the epoxy to cure.
How do I setup my edgeRX sensor on my dashboard?
1. Ensure your edgeRX sensor is turned on.
2. Navigate to the edgeRX sensor page of your edgeRX dashboard (ex. Sensor –>CN2202B 3.0) .

edgeRX sensor Page:

3. Click “Add” to add your new edgeRX sensor.
4. Enter the MAC Address (also known as the Sensor ID) printed on your edgeRX sensor. Enter a custom name you’d like to use to describe your edgeRX sensor. Select which edgeRX Gateway/Network this sensor will connect to in your factory. Click add when all information is present.

5. Confirm that your edgeRX sensor is online after adding using the status field. It may take up to 10 minutes for your edgeRX sensor to show as ‘Online.’ Contact your TDK SensEI representative if you are having trouble with your edgeRX sensor(s).

Once the edgeRX gateway and edgeRX sensors are successfully connected in the factory and appear as ‘Online’ on the edgeRX dashboard, you can begin monitoring the asset in real time.
Note that the sensor BLE signal quality is displayed as Received Signal Strength Indicator (RSSI). An RSSI greater than -60 dBm indicates a good sensor connection quality. An RSSI between -60 dBm and -70 dBm indicates an unstable connection and some functionality may be impacted. An RSSI below –70 dBm indicates very poor connection and significant functionality will be impacted. To improve the RSSI value it’s recommended to move the sensors closer to the gateway or remove barriers between the sensor and gateway.
Machine Learning in edgeRX
How do I Connect AutoML?
1. Navigate to AutoML at automl.qeexo.com
2. In the top right corner, select “Profile”

3. On the profile page, select “Reveal API Key”

4. Copy the API key
5. Return to dashboard.qeexo.com
6. Go to the AutoML tab and paste the AutoML key

Machine Learning Model for AI Inference Results
1. Select the Auto ML page in the dashboard (Cloud icon) to view more details about the machine learning models associated with your organization. If you haven’t yet connected your AutoML account, you’ll need to access your API key. Please reference the “Connect AutoML” section for more details.
2. Select the project of interest to view details on the project, the dataset in the project, and details on models trained.
3. A user can experiment with models using the AutoML interface. AutoML can be accessed through automl.qeexo.com or by going to the dataset, “Launch AutoML” button.


3. Auto ML is the platform is used for training the ML model. For AutoML instructions, please reference the AutoML User Guide.
4. After training a machine learning model in AutoML, navigate to the model page.
5. Use the “Push to Hardware” cloud button to transfer the model to the sensor.

6. Note that when pushing models, ensure that the models are less than 500 KB total size. Please only attempt to push one sensor at a time

How do I setup assets on my egdeRX dashboard?
1. Click “Add” to add your new asset.

2. Enter in all details, including Asset Name, Department, Asset Type, and Criticality (select High, Medium, or Low from the dropdown). Enter the Asset Model (click “+” to add a new model name), choose the Facility name, and input the coordinate values (X and Y). Once all fields are completed, click “Add” to save the entry.
3. Below is how a saved asset appears on the edgeRX dashboard.

4. Next, add edgeRX sensors to the asset to enable machine health monitoring. Click “Add” to add a new edgeRX sensor.
5. Enter all the required details on the edgeRX sensor page, including the sensor type and Sensor ID (edgeRX Sensor Name). Users can view all online edgeRX sensors and select their position and orientation. Please reference the sensor installation guidelines to determine the best mounting location. Click on “add” button to add the edgeRX sensor.

6. You should now see the below image to see that edgeRX sensor is now connected to the machine.

The table below has the default values upon adding on the new edgeRX sensor.

Viewing AI Inference Results: A Step-by-Step Guide
1. After successfully setting up the edgeRX gateway, edgeRX sensor, and asset within the facility, our team will begin data collection and create a machine learning model to monitor the asset. Once the model is trained and deployed, users can now access the AI inference results. These results provide valuable insights derived from sensor data, allowing users to monitor performance, detect class labels (such as anomalies), and make informed decisions.
To view the AI inference results, navigate to the Dashboard and open the Sensor Page. Here, users can explore real-time and historical AI-generated insights, including model updates, class labels, and changes in inference results.
For more details on interpreting the results or troubleshooting any issues, refer to the TDK SensEI support team or send an email.
Open the edgeRX sensor page on dashboard.

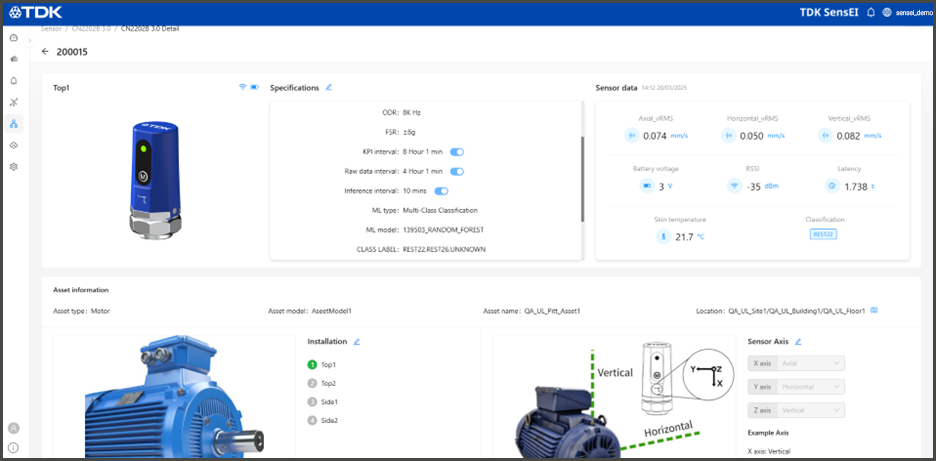
Users can customize their Inference Interval to determine how often the asset status is monitored.
2. At the bottom of the page, click on Inference Results to view the AI inference data. This will show the classification based on the AI model and the anomaly score, which indicates how abnormal the asset is trending. To view the historical record of inference classifications, navigate to the Data Record tab and select AI Inference. Please contact our customer support team or reach out via email for any assistance or clarification.

3. Users can find the ML Model Name, Classification type under the Sensor Specifications section. If the current model’s score and probability do not meet expectations, users have the option to improve model performance. This can be achieved by retraining the model with additional data, fine-tuning parameters, or adjusting threshold values. Regularly reviewing and optimizing the model ensures more accurate predictions and better overall performance.
4. Users can see the history of the deployed model and changes in the logs in the sensor’s page.
How Can I be Notified About Important Events?
1. Navigate to the Alarm page and select “Setting”.

2. Select which notifications to be enabled and enter email address(es) to be notified about the event.

3. If selecting the Asset Warning and Alarms, navigate to the sensor page and edit the specifications.

4. Choose which classes are warnings and which are alarms.

5. Save the Specifications.
Viewing ISO-Based Results
ISO-based results provide standardized insights ISO10816 guidelines to ensure compliance and performance consistency.
1. Open the edgeRX sensor page on dashboard.
2. Users can configure the raw data interval and KPI interval values. These settings determine how often raw data is collected from the sensor node via the gateway and how often KPI values—such as RMS velocity and acceleration—are calculated.
3. Users can view raw data visualizations and KPI values under the Data Record tab, within the KPI Trend or Raw Data sections. These graphs and metrics provide insights into sensor performance and help monitor key parameters over time.


Dashboard Model’s Page

Maintenance
How do I Remove/Add a Battery from the edgeRX Sensor?
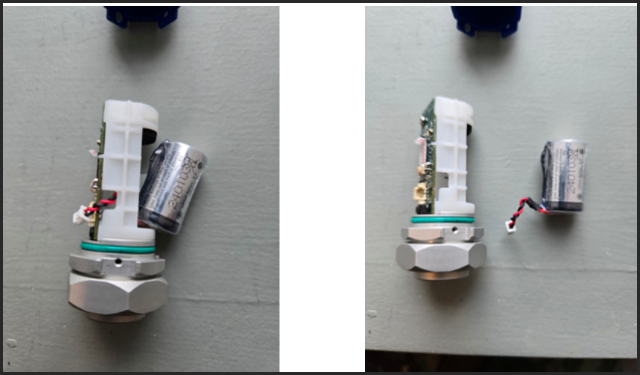
Removing a battery from the edgeRX device
1. Firmly remove the blue cover from the device. The bottom tabs may have small screws that need to be removed.

2. Pull the white tab out of the connector.

3. Pull the battery out of the holder.
Adding a battery to the edgeRX device
1. Feed the black and red cord through the hole on the right side of the device.

2. Push the white connector into the beige holder.

3. Tightly replace the blue cover. Ensure bottom tabs line up. Re-attach screws if needed.

Troubleshooting the edgeRX Sensor
If your battery voltage appears stable and above 2.7 Volts, you can be confident that the offline is not affected by the battery status.
If your battery does not appear stable, you should replace the battery. Please reference the battery replacement instructions.
If you notice that your edgeRx sensor is unexpectedly online, there are a couple steps you can take to troubleshoot them. Below is a list of recommended steps in the preferred order of addressing it.
1. Confirm that your gateway is online. If your gateway is offline, the sensor will also be offline.
Follow the below steps to check your gateway status:
i. Navigate to your dashboard and go to the gateway page (under GW2201D 2.0).

ii. Confirm that your gateway is online.

iii. If your gateway is offline, check the power and ethernet cords are successfully connected to the gateway.
2. If you are physically near the offline sensor, press the button on the sensor once to attempt to reconnect the sensor to the gateway. You can confirm that sensor is attempting to reconnect to the gateway by observing the LED light up on the sensor.

3. If you are not physically near the offline sensor, you can reboot the gateway from the dashboard.
Follow the below steps to reboot a gateway:
i. Navigate to your dashboard and go to the gateway page (under GW2201D 2.0).

ii. Confirm that your gateway is online – you can only reboot the gateway from the dashboard if it’s online.

iii. Check the box next to the gateway and select ‘Reboot’.

4. If none of the above steps work, your sensor battery may have died. First, check the battery voltage graph to check if the voltage showed battery failure.
Follow the below steps to navigate to the battery signal:
i. Navigate to your dashboard and go to the sensor page (under CN2202B 3.0).

ii. Click on the sensor you want to monitor.

iii. Scroll down and go to the Status page.

iv. You will see the battery voltage plot.

Below is an example of a stable battery signal:

If your battery voltage appears stable, you can be confident that the offline is not affected by the battery status.
If your battery does not appear stable, you should replace the battery. Please reference the battery replacement instructions.
If you notice that your edgeRx sensor is unexpectedly online, there are a couple steps you can take to troubleshoot them. Below is a list of recommended steps in the preferred order of addressing it.
5. Turn the sensor off and back on.
i. Open the edgeRx cover as outlined in the battery replacement document.
ii. Turn the sensor off by pushing the switch towards the “OFF” position.
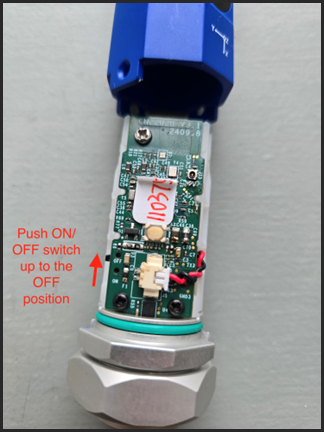
iii. Turn the sensor on by pushing the switch towards the “ON” position.

6. If none of the above steps have worked, please contact your TDK SensEI representative with the trouble shooting steps that you’ve tried and they will provide support.